How does GFlowNet represent distributions and sampling over graphs?
Related description in GFlowNet tutorial: “Because of the sequential construction of objects x (with an arbitrary number of steps), it is very convenient to generate variable-size structured objects, like sets, graphs, lists, programs or other recursively constructed data structures.”
My thought: that means GFlowNet is capable to sample graphs. I don’t know yet how it represents distributions OVER graphs.
TO_BE_ANSWERED.
What does “the flow” mean in the GFlowNet context?
My thought: it’s explained in the GFlowNet tutorial as such: “An intermediate quantity can be estimated, the flow, and the flow in the initial state corresponds to a free energy or normalizing constant”. But I don’t understand…
Wait, it makes sense to say the flow is an intermediate quantity, analogous to the flow rate (Q in Fluid mechanics) of water in a river, which can be measured or estimated at a certain section of the river.
Note 1: in a nutshell, system 2 inspired AI approximates human cognitive inductive biases.
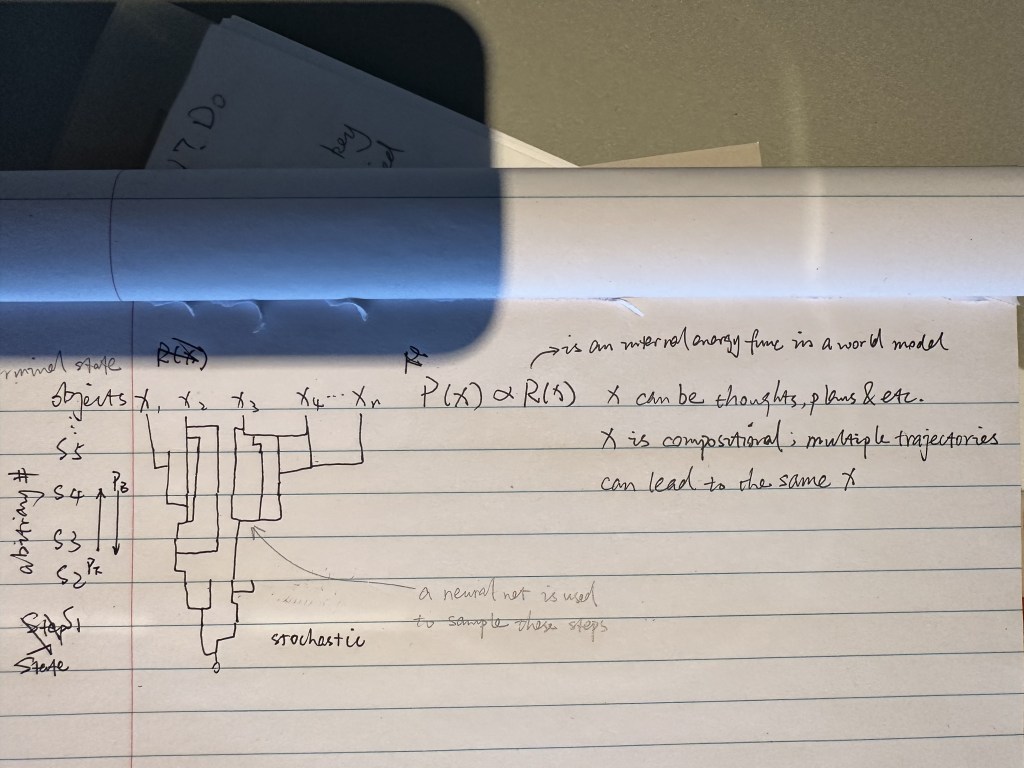
Note 2: gist of GFlowNet in graph by me

Leave a comment